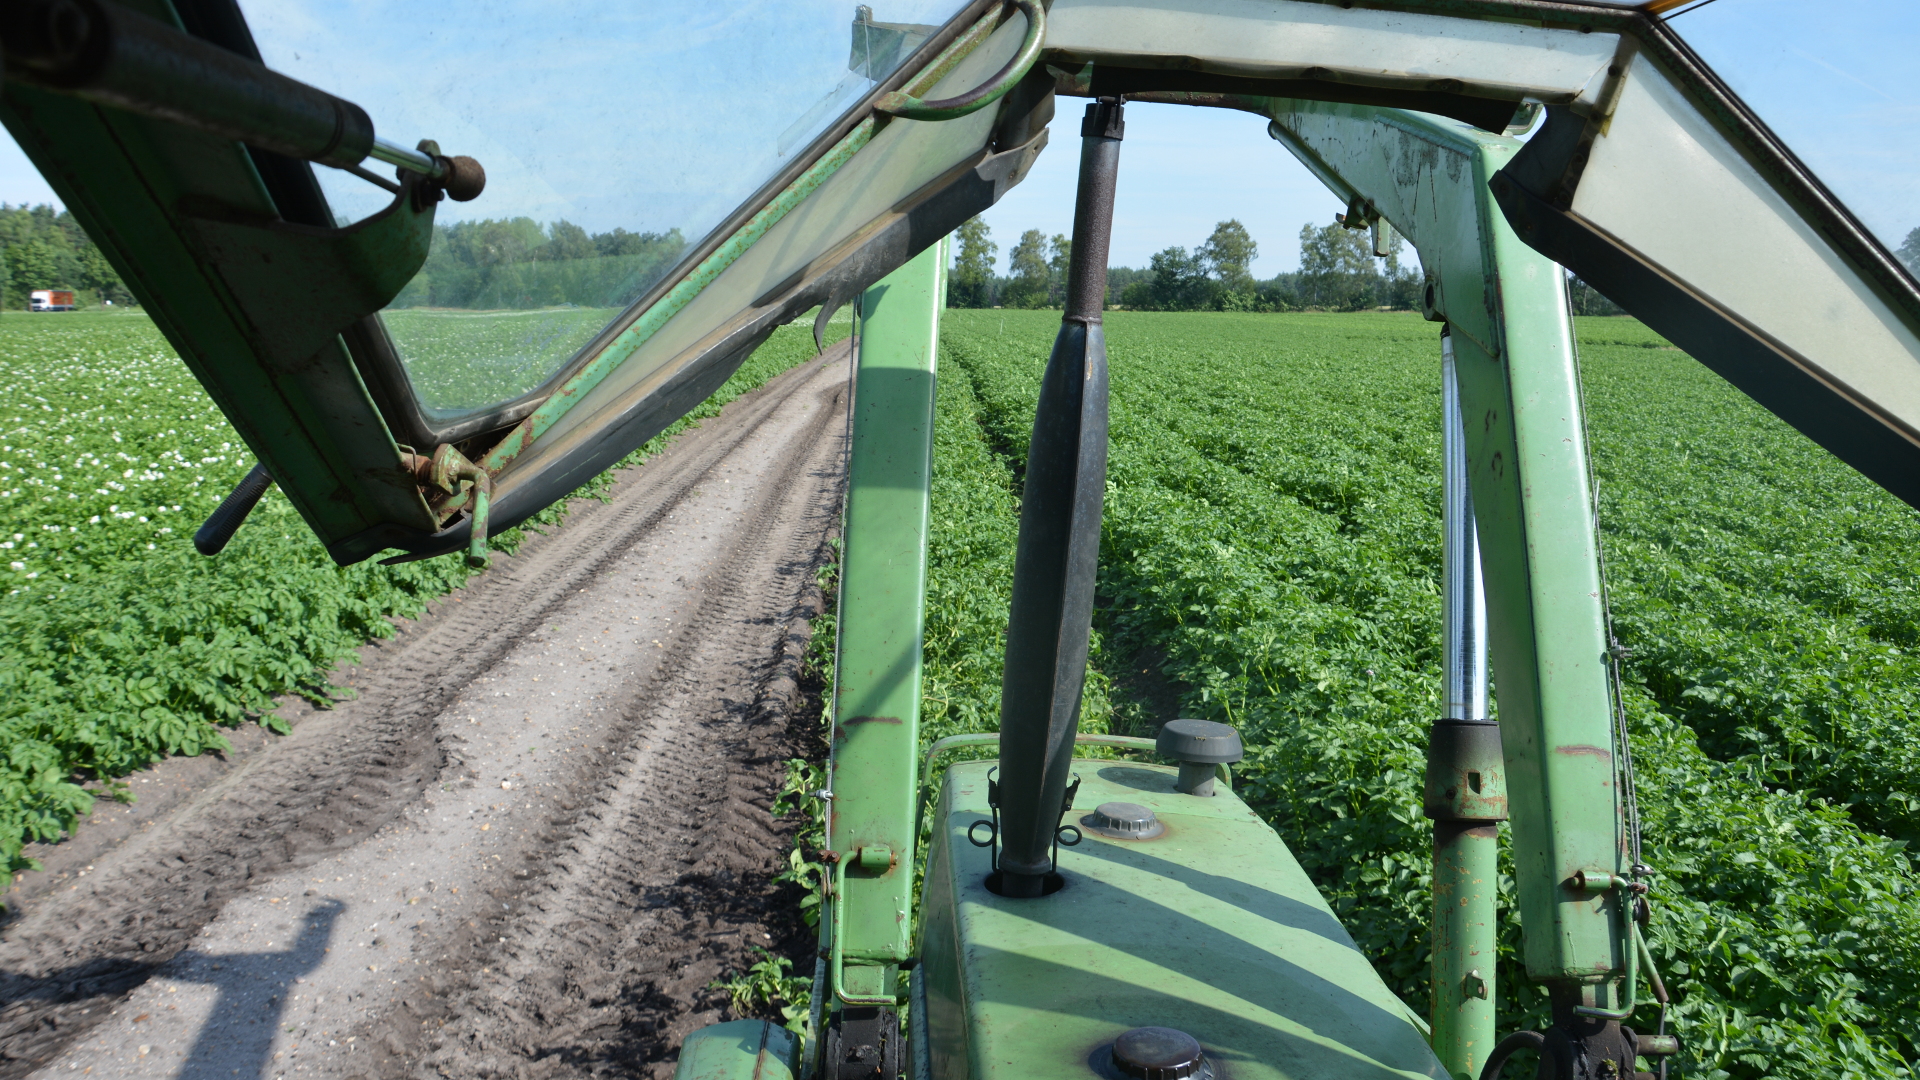
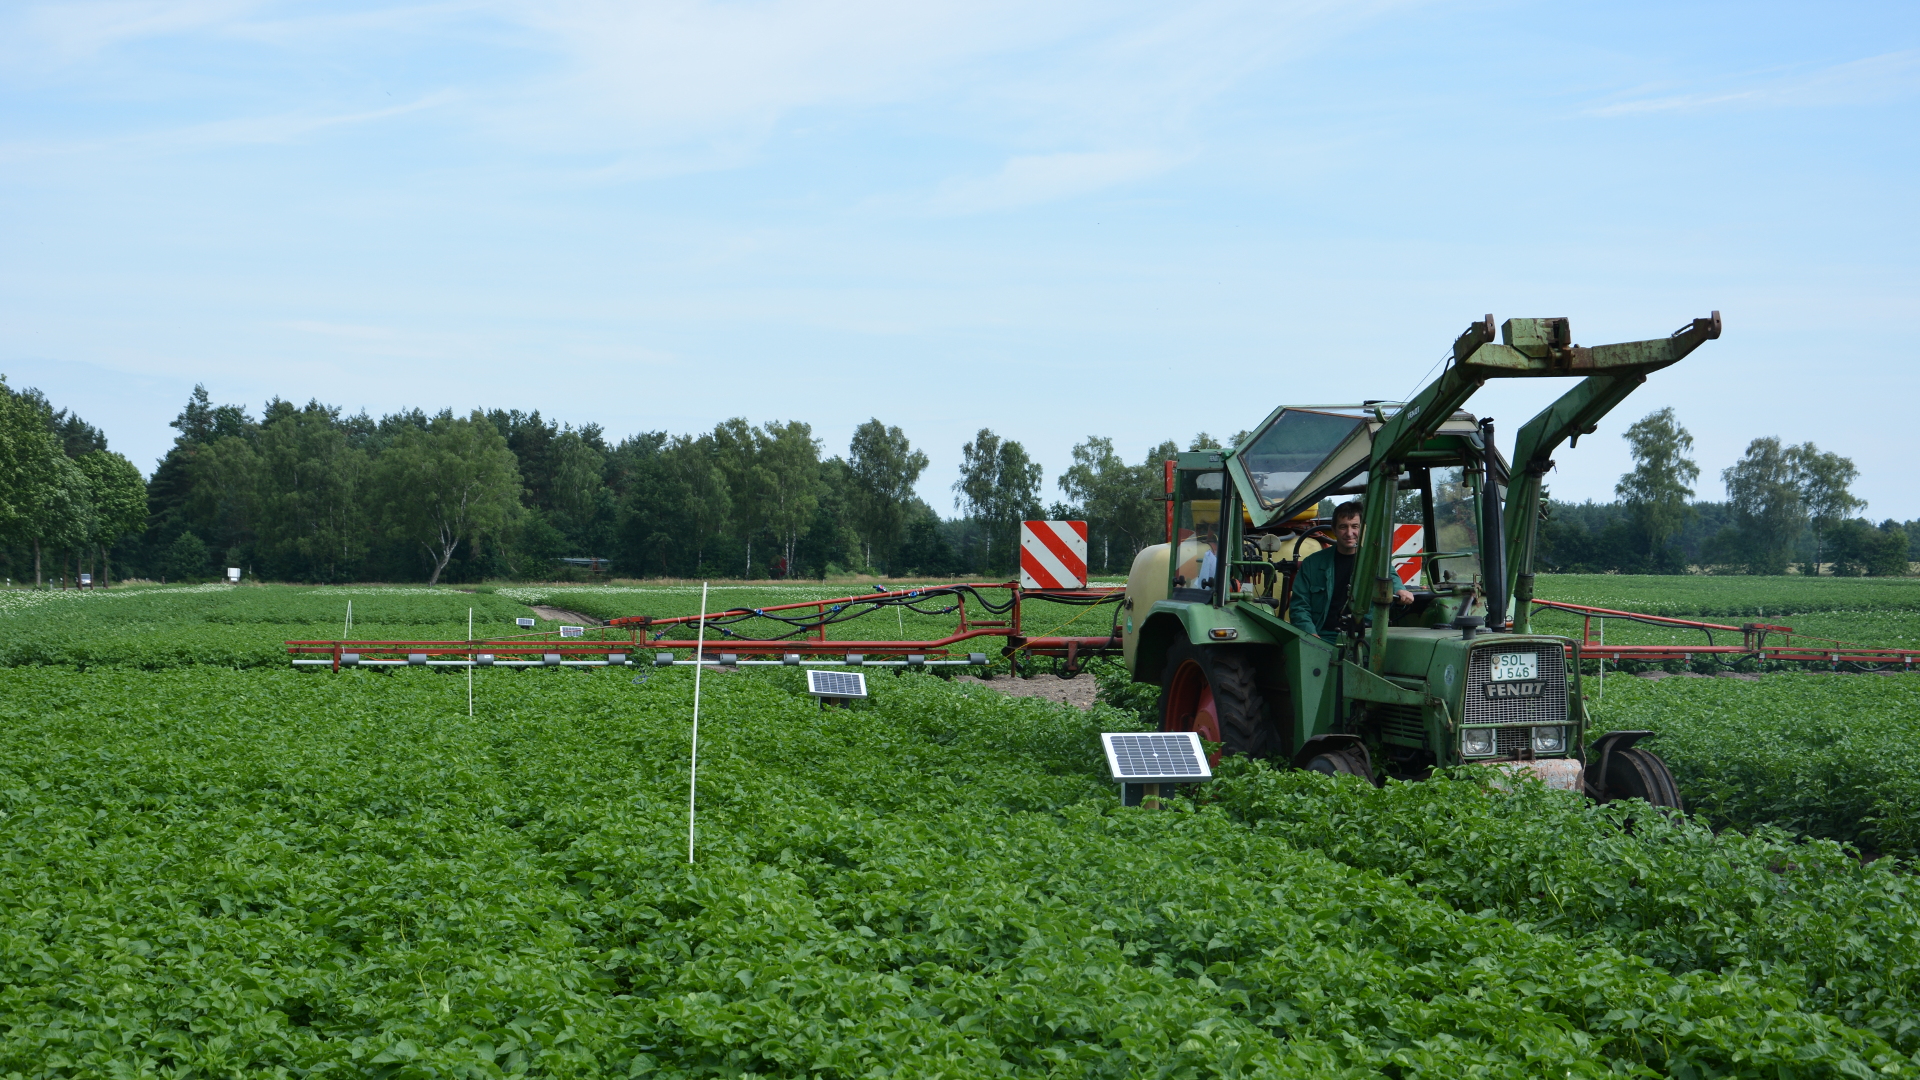
PotatoScanner is a system for drought stress detection developed in cooperation between IBR-CM and VSD. It consists of an Android application and a program for a Raspberry Pi. The software system makes it possible to measure the temperatures of plants in a field with the aid of temperature sensors attached to a field sprayer. The temperatures are measured while driving across the field and linked to the corresponding GPS position of the field sprayer. The software system is integrated into a network of sensor nodes in the field and a data sink on the farm. By using DTN, the data of the sensor nodes can be forwarded from the Pi to the sink using the "Store Carry Forward" principle. The software system allows an evaluation of the network by storing the DTN events created on the Pi.
| Date | Time | Map with measurement results |
|---|---|---|
| 2018-09-03 | 13:50 | TemperatureData20180903-133902 |
| 2018-08-27 | 13:33 | TemperatureData20180827-132200 |
| 2018-08-13 | 14:46 | TemperatureData20180813-143536 |
| 2018-08-06 | 14:37 | TemperatureData20180806-142612 |
| 2018-07-30 | 15:45 | TemperatureData20180730-153954 |
| 2018-07-23 | 12:03 | TemperatureData20180723-115036 |
| 2018-07-16 | 14:51 | TemperatureData20180716-144007 |
| 2018-07-09 | 13:34 | TemperatureData20180709-132213 |
| 2018-07-02 | 13:32 | TemperatureData20180702-131953 |
| 2018-06-25 | 13:25 | TemperatureData20180625-131325 |
| 2018-06-18 | 13:31 | TemperatureData20180618-131838 |
| 2018-06-15 | 11:47 | TemperatureData20180615-113443 |
| 2018-06-11 | 13:45 | TemperatureData20180611-133340 |
| 2018-06-04 | 14:30 | TemperatureData20180604-141904 |
| 2018-05-28 | 14:35 | TemperatureData20180528-143046 |
| 2018-05-28 | 14:17 | TemperatureData20180528-141322 |
| 2018-05-22 | 13:45 | TemperatureData20180522-133214 |
| Date | Time | Map with measurement results |
|---|---|---|
| 2017-08-14 | 12:07 | TemperatureData20170814-120705 |
| 2017-08-14 | 12:01 | TemperatureData20170814-115524 |
| 2017-08-07 | 16:52 | TemperatureData20170807-164050 |
| 2017-08-01 | 11:51 | TemperatureData20170801-114145 |
| 2017-07-24 | 13:13 | TemperatureData20170724-130412 |
| 2017-07-18 | 12:53 | TemperatureData20170718-124324 |
| 2017-07-11 | 12:29 | TemperatureData20170711-121928 |
| 2017-07-04 | 12:11 | TemperatureData20170704-120212 |
| 2017-06-28 | 09:57 | TemperatureData20170628-094235 |
| 2017-06-20 | 09:00 | TemperatureData20170620-084557 |
| 2017-06-12 | 14:01 | TemperatureData20170612-134106 |
| 2017-06-06 | 13:44 | TemperatureData20170606-133218 |
| 2017-05-29 | 13:55 | TemperatureData20170529-133935 |
| 2017-05-22 | 14:21 | TemperatureData20170522-141021 |
| 2017-05-15 | 15:02 | TemperatureData20170515-144928 |
| 2017-05-11 | 11:30 | TemperatureData20170511-112603 |