© IBR, TU-BS
Klaus Sperner
Klaus Sperner
This website covers SVG diagrams which are generated from MIB modules.
In Reverse Engineering Internet MIBs J. Schönwälder and A. Müller develop a reverse engineering algorithm to extract conceptual models from MIB modules. An Implementation of the algorithm is integrated into the libsmi software package as a output driver for the smidump program. It produces XML files which can be viewed with the dia diagram editor.
Scalable Vector Graphics (SVG) is a language for describing two-dimensional vector graphics for the Web in XML.
Based on the reverse engineering algorithm the smidump program was extended by a further output driver which generates SVG diagrams from MIB modules.
In order to display SVG diagrams you need a SVG viewer. At the moment the web browser plugin from Adobe is the most popular viewer. The diagrams produced by smidump have been tested in the following configurations:
| OS | Browser | Plugin | Status |
|---|---|---|---|
| Windows XP | Internet Explorer 6 | Adobe SVG Viewer 3.03 |
|
| Windows XP | Mozilla Firefox 1.0.4 | Adobe SVG Viewer 6.0 Pre-Release |
|
| Linux | Mozilla 1.7.5 | Adobe SVG Viewer 3.01 |
|
| Mac OS X | Safari 1.3 | Adobe SVG Viewer 3.0 |
|
You can test the correct installation of your plugin at Adobes website: Adobe SVG plugin test.
At the moment the SVG driver is only available in the current libsmi sources which can be obtained from the Subversion repository. You can install them following these steps:
svn checkout http://www.ibr.cs.tu-bs.de/svn/libsmi
cd libsmi/trunk/
./autogen.sh --prefix=$HOME
touch lib/parser-smi.lo lib/parser-smi.y
make
make install
Refer to the download section for further instructions.
If you cannot or don't want to compile and install the libsmi software on your own computer, you can use a web interface which generates SVG diagrams. See below.
The general invocation of smidump is described in the manpage. To generate SVG diagrams invoke smidump with the option -f svg. As the XML output goes to stdout, it is highly recommended to redirect stdout into a file. If you specify multiple module arguments you should use the option -u, otherwise your generated XML file will be invalid. Here are two basic examples:
smidump -f svg ./IF-MIB > IF-MIB.svg
smidump -u -f svg ./IF-MIB ./IF-INVERTED-STACK-MIB > IF-MIB-IF-INVERTED-STACK-MIB.svg
The SVG output driver understands the following options:
| --svg-width=number | Width of the SVG output (default=1100) |
| --svg-height=number | Height of the SVG output (default=700) |
| --svg-show-deprecated | Show deprecated objects |
| --svg-show-depr-obsolete | Show deprecated and obsolete objects |
| --svg-static-output | Disable all interactivity (e.g. for printing) |
Enhanced examples could look like this:
smidump -f svg --svg-static-output --svg-show-depr-obsolete ./IF-MIB > IF-MIB.svg
smidump -f svg --svg-width=800 --svg-height=600 ./IF-MIB > IF-MIB.svg
A sample output of smidump -f svg ETHER-WIS would look like this:
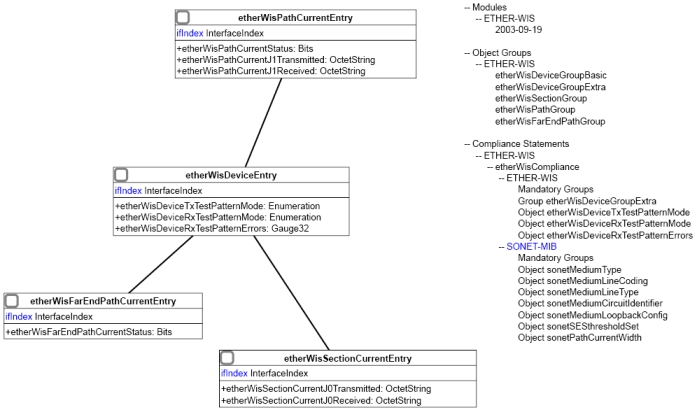
On the left side the UML class diagram of the MIB modules, which is generated by the reverse engineering algorithm, is displayed. There is a UML class for each conceptual row definition in the MIB modules. These are organized as follows:
In the latter three sections each entry shows the name of an object and its type. If the object is not-accessible it is preceded by a -, otherwise by a +. When the mouse is moved over the object name or the type a tooltip shows the appropriate description. An objects which is printed in blue color represents a links to new a SVG diagram showing the MIBs currently displayed and the MIB in which the object is defined.
All scalar objects which are not bound to a conceptual row are logically grouped into additional UML classes which only contain these scalar objects. (There is no such class in the example.)
In addition to the unlabeled edges shown in the example there are 4 types of labeled edges: augments, sparsly augments, reorders and expands. The meanings of these labels are explained in the paper mentioned above. Each labeled edge also comes with cardinalities and arrowheads. Dashed edges are so called dependency relationships.
On the right side varios additional information about the modules are shown:
As mentioned above a web interface to smidump is provided. It gives an easy to use alternative to generate SVG diagrams in an interactive manner. Within the interface you can select multiple MIBs which come with the libsmi distribution. Additional you can upload a MIB from your computer which will then be used as input for smidump. Furthermore all the options described above in the invocation section can be selected by text fields, radio buttons or check boxes.
Mail comments and suggestions to the libsmi mailing list: libsmi at ibr.cs.tu-bs.de.